Why a business intelligence dashboard?
This client’s business has grown rapidly. Early and reliable knowledge of which tours work and which don’t is vital to its continued success and planned expansion to more of the world’s most exciting cities.
The company was established in 2005; it has an average of 44 gastronomic tours per city per week (up to 2,000 transactions a month). They had a huge data flow which they were unable to analyse.
They, therefore, needed a reporting tool that could analyse data from their event booking system, as well as the individual accounting systems in each of the local countries and present it in a way that gave the leadership team usable insight into the business
The Client
This client offers #1 rated Food Tours and Cooking Classes in Rome, Florence, London, Amsterdam and Prague. They believe there is no better way to experience a city than through its food.
All their tours not only feed you the best each city has to offer but also immerse you in the local culture, authentic street life and special history. You’ll feel at one with the locals, meet the vendors and come away with a real sense of what each city is really about.
Their mission is to leave travellers with an unparalleled, non-touristy, food-related experience in undiscovered neighbourhoods of the most fascinating cities in the world.
Why Isosceles and ireport?
“It is difficult to find a company like Isosceles that is able to effectively, efficiently, and with a great personal touch deliver such a breadth of financial services. Our work with Isosceles has had a tremendous impact on our business and has definitely generated a positive ROI.” Founder and CEO
This client chose us because:
- The quality, knowledge and responsiveness of the team
- Focus on technology clients
- Track record in supporting and advising growing businesses
- Experience in building business intelligence dashboards for similar companies
Our Role
- Identify and map all the current data sources
- Determine with the leadership team what KPIs they should be monitoring
- Identify any immediate systematic and operational improvements
- Build a visual analytics dashboard that would enable the leadership team to monitor to a fine level of granularity the businesses performance against their KPIs
Related Article | Why choose Power BI as your business intelligence platform?
Bringing the numbers to life
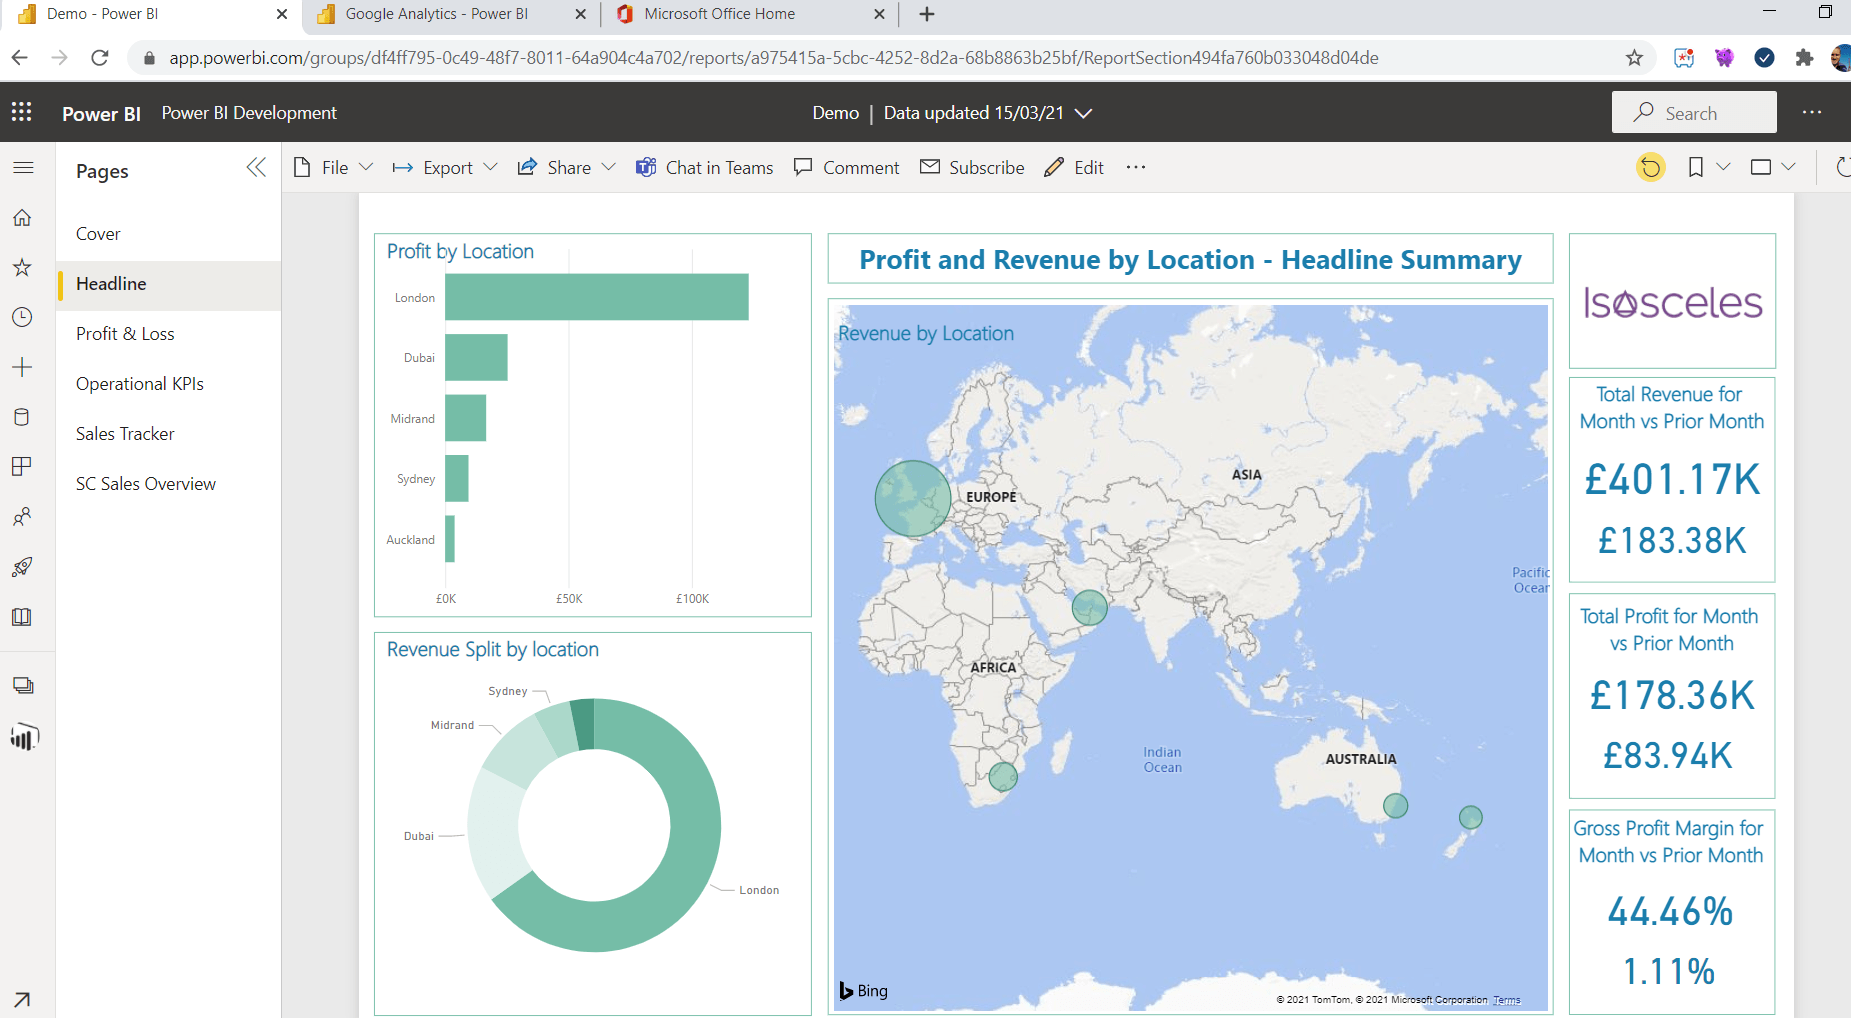
The interactive business intelligence dashboard, based on Microsoft’s PowerBI, brought the numbers to life:
- Accessible by all locations and securely delivered via the web.
- It enables Eating Europe to monitor performance against KPIs
- Used as the basis for discussion and effective decision making at the monthly management meeting
- They are able to view information at whatever level of detail is required – from a whole company view (birds-eye view) down to individual locations and tours.
- Eating Europe have a variety of ways to visualize complex data – key figures, charts and trends all clickable, drillable and interactive.
- They also have the ability to select easily between monthly, year to date, plans and prior year metrics and comparisons.
The dashboard is now used as the basis for discussion and effective decision making at the monthly management meetings.